


Metrics for learning products
What are the right metrics to track to create transformational learning products? The final part of my series on product thinking for learning.

🧩 This is part five of my series on product thinking for learning.
So far we have covered product mindset, product-market fit, product discovery and cross-functional product teams and explored how these ideas apply to learning products.
To wrap up this series, we’re going to look how you measure success with product metrics. And again, think about how these apply in learning.
Using data is also key to the product mindset. This is where the scientific method comes in that balances the art of discovery and creation.
Let’s dive in.
Measuring desirable, viable, feasible, usable
I’ve used the desirable, viable, feasible, usable framework to explore each of the bigger concepts to help bring coherence to the different ideas that connect product thinking. I’ve suggested that the key to product thinking is to keep all four of these qualities in your head at once.
These four things are also a useful starting point to understand the important things that you should be measuring.
Before we get in to them, here’s a quick recap of my definitions for learning products.
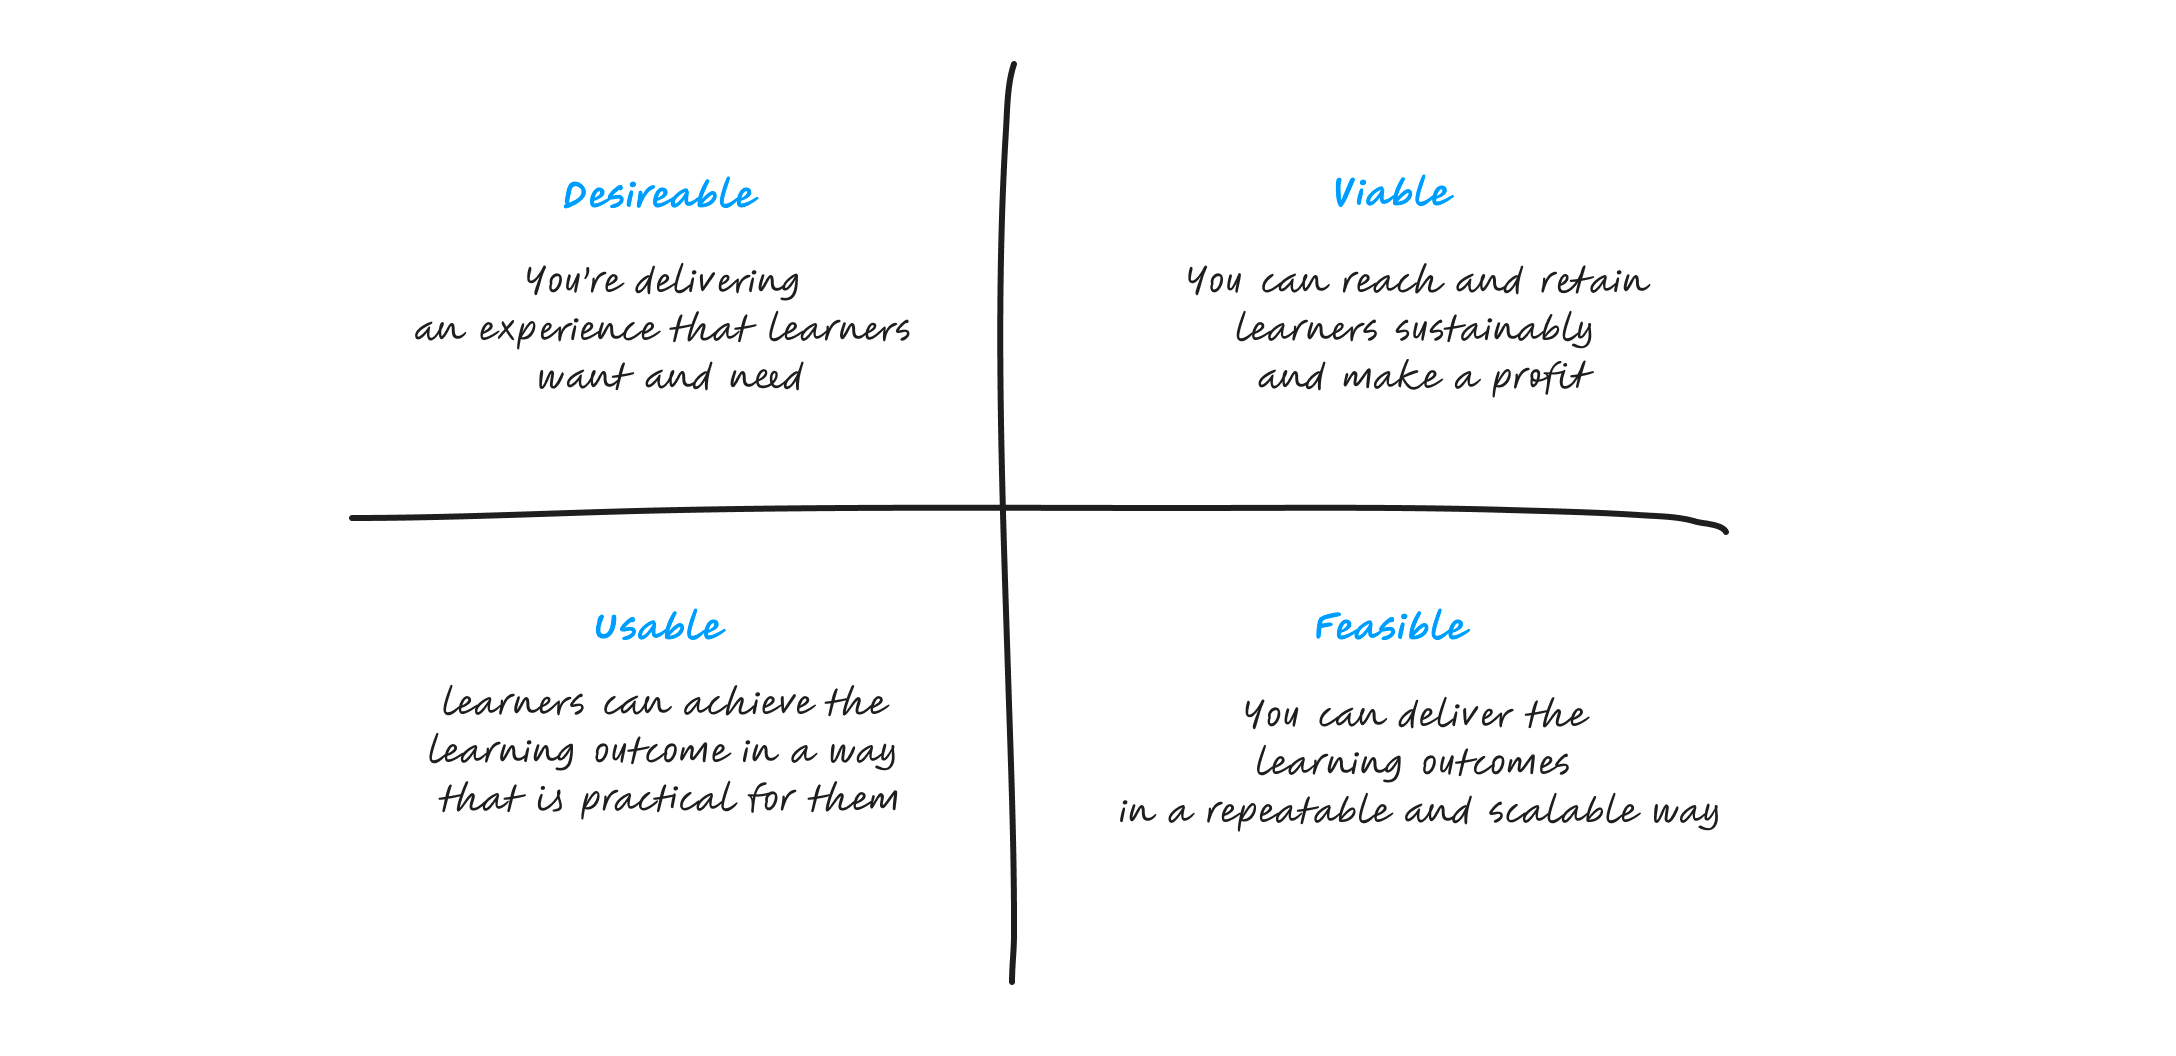
(As previously noted, for some products you might want to switch the word ‘learners’ for ‘educators’. Profit also might be some other measure of sustainability.)
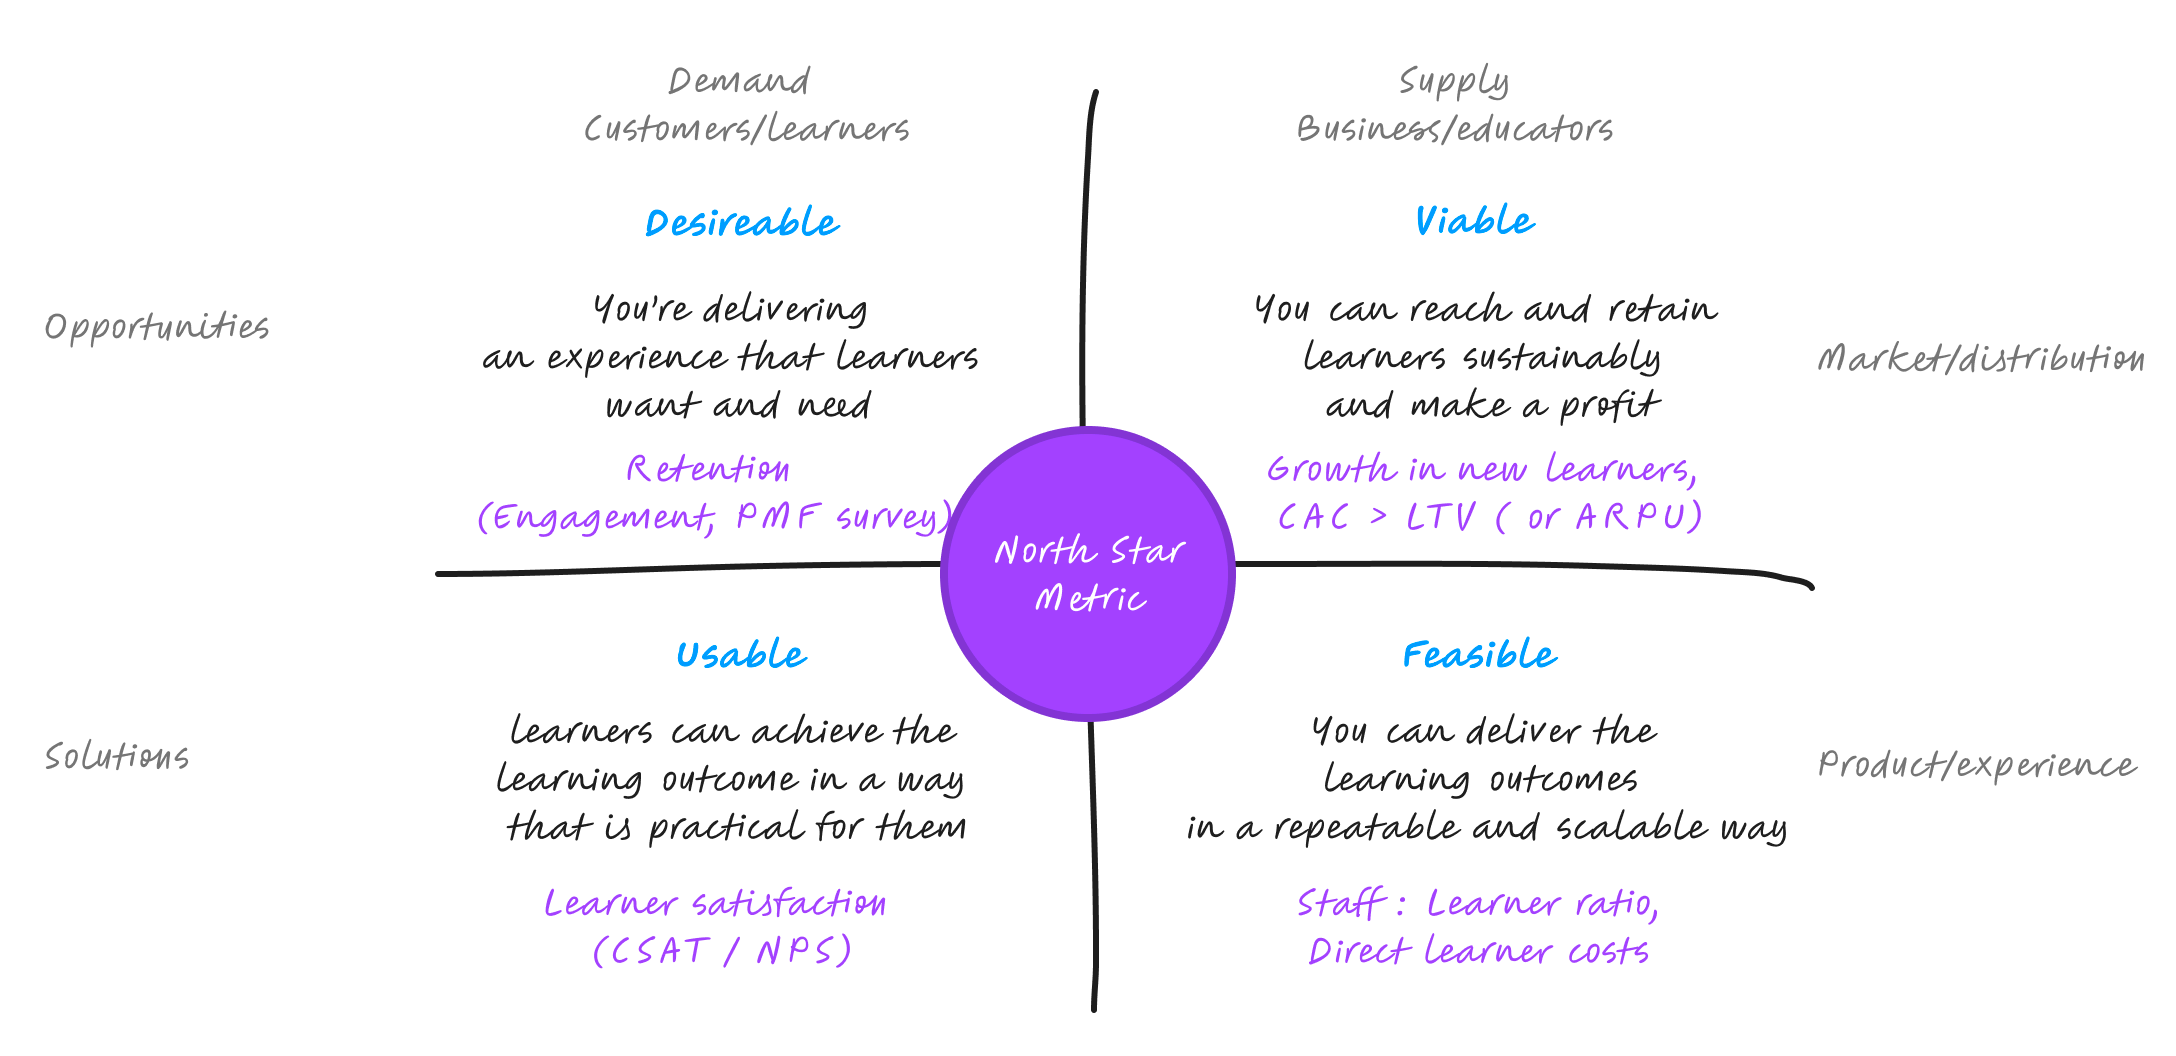
Let’s go through each quality one-by-one, starting on the left-hand side of the 2x2.
Then we’ll explore the idea of a North Star Metric that sits in the middle and can help bring these things together.
Finally we’ll reflect on the tricky subject of measuring outcomes.
1. Desirable
Desirability is all about retention.
There are some that will tell you that for product-market fit, nothing matters more than retention. Other metrics are important as we will get into. But certainly the best measure of ‘you’ve built a product that learners want and need’ is if they use it and then keep coming back.
If they don’t, you have the ‘leaky bucket’ problem and will struggle to grow or create advocates for your learning experiences.
Retention
Retention measures the ability of your product to keep users active over time.1
Let’s break that down.
Define ‘active’: What is the main activity that the learner does in order to learn? What is the smallest pedagogic unit you can measure? Active is not simply logging in.
Define ‘users’: Which users is your business model depending on? If you have free and paid users you need to separate them. In a marketplace business you may also want to look at retention of different kinds of users e.g. learners and educators.
Define ‘over time’: What time period is useful to look at depends on your realistic expectation of how often people should perform the learning activity. It may not be daily. But is likely to be related to how often it needs to be to effectively learn.
Here’s what was important at FutureLearn.
FutureLearn’s core learning activity was completing a ‘step’ within a course. We also tracked course completions.
We looked at both free and paying learners. We also also measured how often a university partner created a course as another key user in the marketplace.
We looked at weekly retention. We didn’t expect learners to visit every day. But whether a learner came back week-to-week had a big impact on if they completed a course.
Activation and engagement
The problem with retention is that it tends to be a laggy metric, particularly for learning experiences that take time. This is where engagement is a good leading indicator.
Do new users ‘see the magic’, activate and engage in the core learning activity? Do they come back and do it again soon? Are lots of learner regularly engaging in the core learning activity?
Are there other related actions they engage in such as leaving a comment?
PMF survey
Another helpful leading indicator is the Product-Market Fit Survey, developed by Sean Ellis.2
The idea is simple. Just ask users “how would you feel if you could no longer use the product?” and measure the percent who answer “very disappointed.”
If less than 40% respond with “very disappointed” then you’re probably struggling to get traction. But if more than 40% respond with “very disappointed” this is a strong leading indicator you’ve found product-market fit with a particular segment.
The trick is to also ask some questions in the survey that helps you to understand which segment feels this way about your product and why and then double down on that.
2. Usable
Are learners able to achieve the learning outcomes in a way that is practical to them? This is all about understanding their satisfaction and so generally requires a survey combined with more qualitative research.
NPS
Lots of people use Net Promotor Score to measure this. This is the survey question that asks how likely you are to recommend the product to a friend or colleague.3
CSAT
Many now argue that CSAT - Customer Satisfaction - score4 is a better way to do this as it is more straightforward and there are fewer assumptions.
Teaming this with questions like ‘how would you rate the materials/teaching’, ‘how engaging did you find it’, ‘how confident do you feel to apply it’, ‘how easy was it to use’… etc. also enable you to understand usability.
3. Viable
The first part of this is to understand if you are in what Marc Andreessen refers to as “a good market”.5 Are there enough people with the same needs and desires? And are you able to reach them effectively?
Growth in new learners
This is about looking at growth alongside retention. Are you seeing significant growth in new learners as well as retaining existing ones?
CAC < LTV
The other key part to understand is does the revenue you generate from learners amount to significantly more than it costs to find (and keep) them?
This is sometimes referred to as CAC < LTV. Or the Customer Acquisition Cost is less than the Lifetime value. For early stage, it’s generally better to look at Annual Revenue Per User (ARPU) as Lifetime Value is often hard to calculate.
This is all about matching your product to the right acquisition channels (viral, SEO, paid, sales) and business model.6
4. Feasible
My definition of feasible is that it’s possible to deliver the learning outcomes in a repeatable and scaleable way. This is often hard in learning where often the learning experience requires human interactions.
There are lots of ways that you can come at this problem. Here’s two that are worth tracking.
Learner:staff ratio
To begin with this might be quite low. But as you grow, ideally you don’t want this to grow in a linear way. If it does, then what you’re offering is more of a service than a product. This might be OK, but this will have an impact on if you can make a profit and you need to understand it.
Linear growth can also may make it harder to consistently keep delivering the same quality if it is dependent on a hiring specific kind of human and the kind of relationship they want with learners and colleagues. Again, something to understand.
Direct learner costs
Similarly, you want the cost of delivery to be low and ideally reduce as you take advantage of the economies of scale. This could be things like streaming costs, cost of sale or classrooms.
5. North Star Metric
We’ve completed our tour of the four boxes. But I also included the idea of a North Star Metric in the middle.
This was also coined by Sean Ellis. The idea is that the North Star Metric is the single metric that best captures the core value that your product delivers to customers.7
In the words of Sean:
“To uncover your North Star Metric you must understand the value your most loyal customers get from using your product. Then you should try to quantify this value in a single metric.”
Well known examples of this are:
Airbnb/Uber: nights/trips booked
Netflix/Spotify: viewing/listening hours
Miro: Collaborative boards
This again comes back to identifying the core learning activity. You also need to understand how the core action relates to the value learner receives and how you make money and grow.
Airbnb and Uber get paid for trips in a transaction model. Pay per trip. Netflix and Spotify rely on subscription revenue and their users getting continued value from the product to avoid churn in subscriptions. Miro grow through people sharing their boards with others, which helps them sell into companies.
Ideally your business model should relate to the core value your product provides which is probably learning.
If you can find the right learning activity, then this metric can helpfully bring together:
Retention and engagement: learners regularly doing the activity (desirable)
Growth: more learners doing the activity (viable)
Revenue: learners paying to keep doing the activity (viable)
Usable: learner able to do the activity (usable)
Feasible: it’s possible for more learners to do the activity (feasible)
This sort of simplification can be helpful. But be careful to make sure that you continue to understand the dynamics driving it.
6. Outcomes
Finally, we should discuss outcomes. Ultimately, this is what learning is all about.
The problem with learning outcomes is that they take time to see the results and are often hard to attribute.
You can measure outcomes with assessments. Or by running a survey like the Kirkpatrick model that looks at behaviour and results some months after the training.8 But the laggy nature of this makes it hard to guide what you do.
Often you need to find proxies or correlations that makes things easily actionable.
This could be as simple as attributing learning to your core action. This is apparently Duolingo’s approach. Practicing everyday must help people improve their vocabulary in another language.
Sometime you can also find a ‘golden’ metric that strongly correlates with your desired outcomes.
Trilogy discovered that improving how well a student felt supported strongly correlated with their satisfaction of achieving their goals at the end of a course and so focused on improving this.
At FutureLearn, we found that social learners were six times more likely to compete courses and so encouraged this as there is much research that suggests it also benefits learning.
Ultimately your stance on this will probably depend on the kind of product you are creating and who is interested in the outcomes.
To recap
Identify the core learning activity, the smallest pedagogic unit as this will help you define other metrics
Measure desirability by tracking retention and looking at engagement in the learning activity and using tools like the PMF Survey as leading indications and to help you understand it better
Explore viability by looking at growth in learners and keeping Customer Acquisition Costs well below your Lifetime or Annual Revenue per Learner
Understand usability by running some kind of satisfaction survey
Gauge the feasibility and potential to scale by looking at metrics like the learner:staff ratio and direct learner costs
Find proxies and things that correlate with learning outcomes that enable you to quickly understand the potential impact of changes you make on your ultimate goal
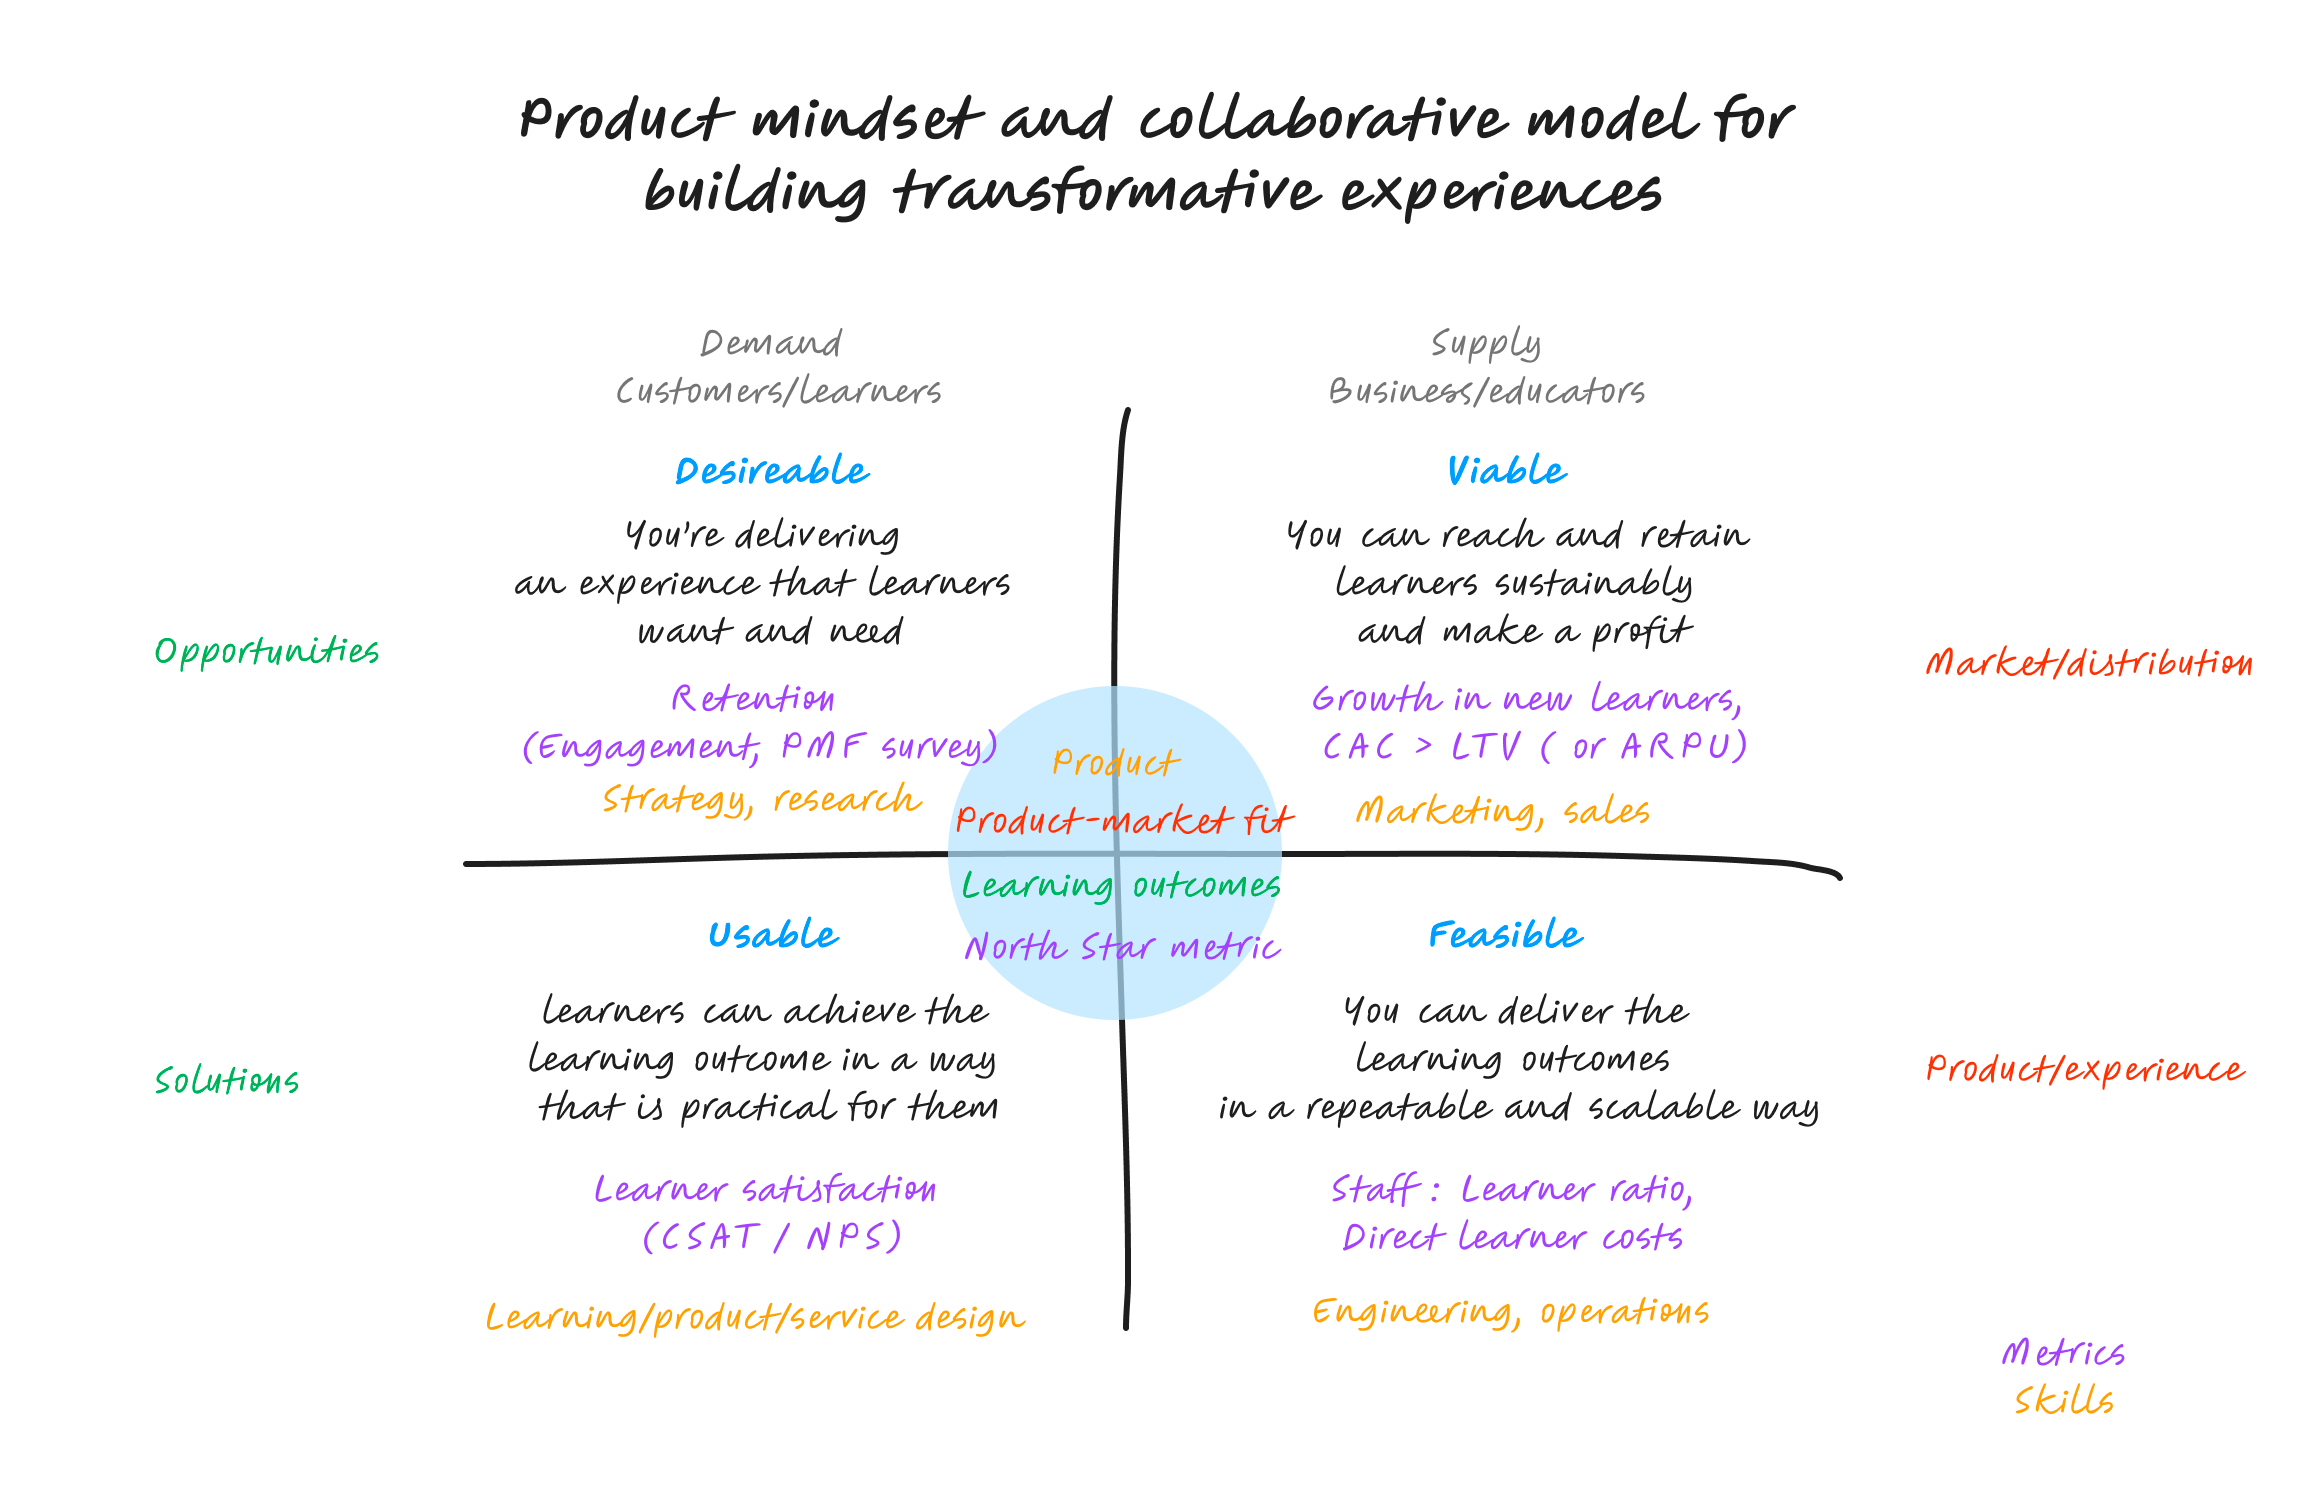
This completes this first series on product thinking in learning. Over the last five articles we’ve built up a picture of the key concepts behind a product mindset. Here it is brought together onto a single - if busy - 2x2. I hope that this provides an interesting thinking tool.
I would love to know what you think and what you do with it. Please get in touch and let me know.
If you’re interested in exploring how to measure retention, there’s great Lenny’s newsletter guest post by Olga Berezovsky. I’ve used her definition.
Read Sean Ellis’ original article about using the PMF survey. Also here’s a great case study on how SuperHuman put the PMF survey into practice.
The second part of how Mark Andreessen defined product market fit in his essay The Only Thing That Matters.
See Brian Balfour’s ideas on product-channel fit, channel-model fit and model-market fit.